Эффективность сверхмалых концентраций диоксида хлора против вируса гриппа типа А (ENG)
СтатьиProtective Effect of Low-concentration Chlorine Dioxide Gas Against Influenza a Virus Infection
Norio Ogata, Takashi Shibata
Research Institute, Taiko Pharmaceutical Co. Ltd, 3-34-14 Uchihonmachi, Suita, Osaka 564-0032, Japan
Influenza virus infection is one of the major causes of human morbidity and mortality. Between humans, this virus spreads mostly via aerosols excreted from the respiratory system. Current means of prevention of influenza virus infection are not entirely satisfactory because of their limited efficacy. Safe and effective preventive measures against pandemic influenza are greatly needed. We demonstrate that infection of mice induced by aerosols of influenza A virus was prevented by chlorine dioxide (ClO2) gas at an extremely low concentration (below the long-term permissible exposure level to humans, namely 0.1 p.p.m.). Mice in semi-closed cages were exposed to aerosols of influenza A virus (1 LD50) and ClO2 gas (0.03 p.p.m.) simultaneously for 15 min. Three days after exposure, pulmonary virus titre (TCID50) was 102.6±1.5 in five mice treated with ClO2, whilst it was 106.7±0.2 in five mice that had not been treated (P=0.003). Cumulative mortality after 16 days was 0/10 mice treated with ClO2 and 7/10 mice that had not been treated (P=0.002). In in vitro experiments, ClO2 denatured viral envelope proteins (haemagglutinin and neuraminidase) that are indispensable for infectivity of the virus, and abolished infectivity.
Taken together, we conclude that ClO2 gas is effective at preventing aerosol-induced influenza virus infection in mice by denaturing viral envelope proteins at a concentration well below the permissible exposure level to humans. ClO2 gas could therefore be useful as a preventive means against influenza in places of human activity without necessitating evacuation.
Introduction
Among the most frequent infections of the upper and lower respiratory tracts in humans are those caused by influenza A virus, an enveloped, negative-sense, singlestranded RNA virus (Skehel & Hay, 1978; Ghendon et al., 1981; McCauley & Mahy, 1983). In a typical year, the virus infects 15-20% of the population, causing >500 000 deaths worldwide (Thompson et al., 2003; WHO, 2003), but the most frightening effects are seen when new strains of virus emerge, resulting in devastating pandemics (Reid & Taubenberger, 2003). Current reports of avian-to-human transmission of influenza A virus, particularly of the H5N1 subtype, make the prospect of new pandemics particularly alarming (Webby & Webster, 2003; Webster et al., 2007). It cannot be overemphasized that novel strains of influenza virus have the potential to cause devastating pandemics in the near future (Palese, 2004). In the past century, three outbreaks of influenza virus infection have caused significant numbers of human fatalities. Among them, the 1918 strain was particularly notable for its infectivity and the severity of the disease (Kong et al., 2006).
As with many respiratory viruses, influenza virus spreads in the air as aerosols (droplets) expelled from an infected human. It needs to attach to and penetrate target cells to establish infection (Wagner et al., 2002). The principal route of entry of the virus into target cells takes place by binding to a receptor on the surface of a respiratory-tract epithelial cell, with subsequent transfer of viral genetic materials into the infected cell (Wagner et al., 2002). The envelope of the influenza virus carries two major surface glycoproteins, haemagglutinin (HA) and neuraminidase (NA) (EC 3.2.1.18). HA plays a key role in initiating viral infection by binding to sialic acid-containing receptors on host cells and mediates viral entry into cells and fusion with the cellular membrane (Tsuchiya et al., 2001; Wagner et al, 2002; Bentz & Mittal, 2003). At a later stage of infection, NA also plays a key role by releasing sialic acid residues from the surface of progeny virus particles and from the infected cell, facilitating viral release (Solorzano et al., 2000; Wagner et al., 2002; Gong et al., 2007). When influenza virus is deficient in NA activity, progeny virus particles aggregate at the surface of the infected cell, severely impairing further spread of the virus to other cells. Both HA and NA are indispensable for successful infection and spread of this virus. Several antiviral compounds, such as zanamivir, oseltamivir and resveratrol, have been developed, but their long-term efficacy is still limited by toxicity and inevitable selection of drug-resistant viral mutants (Nicholson et al., 2003). Vaccination against influenza virus still has limited efficacy, and complete prevention of the disease is not yet possible (Ge et al., 2004).
Chlorine dioxide (ClO2) is a water-soluble, yellow gas with a characteristic chlorine-like odour and strong oxidizing activity (Moran et al., 1953; Fukayama et al., 1986; Ogata, 2007). It is commonly generated by adding acid to sodium chlorite (NaClO2) solution. ClO2 is a free radical, owing to one unpaired electron in its molecular orbital (ClO2) (Lynch et al., 1997). Possibly due to its strong oxidizing activity (Moran et al., 1953; Fukayama et al., 1986), when dissolved in water, ClO2 has potent antimicrobial activity against bacteria, fungi, protozoa and viruses (Taylor & Butler, 1982; Harakeh et al., 1988; Chen & Vaughn, 1990; Foschino et al., 1998; Eleraky et al., 2002; Schwartz et al., 2003; Sivaganesan et al., 2003; Li et al., 2004; Loret et al., 2005; Sy et al., 2005; Wilson et al., 2005; Okull et al., 2006; Simonet & Gantzer, 2006). However, the antimicrobial activities of gas-phase ClO2 have not been well studied. This is especially true of ClO2 gas at very low concentrations (subtoxic levels) that are sufficiently safe to use in places of human activity without evacuation. According to the US Occupational Safety and Health Administration, the long-term (8 h) permissible exposure level of ClO2 in environmental air in a human workplace is 0.1 p.p.m. (v/v) (US Department of Labor, Occupational Safety and Health Administration, 2006).
If gas-phase ClO2 is shown to have potent antimicrobial activity at a subtoxic level, it would be useful to employ it at such levels to prevent transmission of respiratory infections in public places such as offices, schools, theatres, hospitals and airport buildings without evacuating occupants. The purpose of the present study was to determine whether ClO2 gas at a subtoxic level can protect against influenza A virus infection by using a mouse-influenza model. The mechanism of the effect of ClO2 against this virus was further substantiated by in vitro biochemical experiments.
Methods
Reagents, animals and virus. Sodium chlorite (NaClO2) was obtained from JT Baker. All other reagents were of reagent grade. CD-1 male mice, 6-8 weeks of age, were purchased from Charles River Laboratories. They were acclimatized in the laboratory for at least 1 week before the experiment. For each set of experiments, groups consisted of 15 mice. Five were sacrificed on day 3 (72 h) after exposure to virus aerosols (see below) for virus titre determination in their lungs and pathological examinations of lung tissue. Ten animals were observed further for mortality until day 21. The animal experiment was approved by Taiko Pharmaceutical Experiment Committee. Influenza virus strain A/PR/8/34 (H1N1) was used for animal experiments, and strain A/New Caledonia/20/99 (H1N1) was used for all in vitro experiments. These viruses were grown and propagated by using Madin-Darby canine kidney (MDCK) cells and Eagle’s minimum essential medium (MEM) supplemented with 10% fetal bovine serum. They were purified by velocity density-gradient centrifugation through a 20-50 % linear sucrose gradient. Virion-containing fractions were collected, titrated and stored at —80 °C until use. Just before use, a vial of virus was thawed quickly and diluted with Dulbecco’s PBS to approximately 1 LD50 (one 50% lethal dose) when delivered as aerosols. Mice were exposed to this preparation for 15 min. The diluted virus suspension was placed in a reservoir of an Aero-Mist nebulizer (CIS-US, Inc.). As a no-virus control, another interchangeable nebulizer holding a reservoir of PBS alone was used in parallel. The virus and no-virus aerosols were changed quickly by a converter (Fig. 1). The day of aerosol challenge was termed day 0.
ClO2 generator. The ClO2 generator was made in our laboratory (Fig. 1a). ClO2 was generated by mixing 250 mM HCl with 28 mM NaClO2; these solutions were delivered into a reaction vessel by precision liquid pumps A and B. ClO2 was generated according to the reaction 5NaClO2 + 4HCl→4ClO2 + 5NaCl + 2H2O. ClO2 generated in the reaction vessel was next bubbled with air to expel it as gas. Approximately 50 p.p.m. ClO2 gas came out of the vessel at a flow rate of 0.4 l min—1. The ClO2 gas was next diluted by air using air pumps B and C. Finally, ClO2 gas at approximately 0.8 p.p.m. was delivered from the generator into the mouse cage at a flow rate of about 1.8 1 min—1 (Fig. 1). Concentration and flow rate of ClO2 gas were adjusted finely by a concentration regulator and a flow-rate regulator, respectively, to meet the gas concentration and flow rate required for the experiment. The ClO2 gas was finally delivered into the mouse cage as shown in Fig. 1(b).
Set-up of the animal experimental system. For exposure of mice to ClO2 gas and virus aerosols, experiments were done in a class II biosafety cabinet. A semi-closed mouse cage of 26 x 37 x 18 cm (inner dimensions) containing 15 mice was placed in the biosafety cabinet (Fig. 1b). A battery-powered electric fan (2x6x6 cm) to circulate air inside the cage was inserted in the cage with the mice and a battery box. The plexiglass cage was airtight except for the top cover, which was placed loosely on the cage so that air could seep out from the cage to prevent build-up of pressure within the cage. One of two interchangeable nebulizers, containing either PBS alone or virus suspension in PBS, was connected to an air pump (Fig. 1b). Aerosols made by the nebulizers, either of PBS alone or of virus suspension in PBS, were delivered into the mouse cage. The above-mentioned two kinds of aerosol were interchanged quickly by the converter. ClO2 gas or air (0 p.p.m. ‘gas’ as a control) was delivered into the cage through another hole (Fig. 1b, right). A sampling tube of a ClO2 analyser (model 4330-SP; Interscan Corporation) was inserted into the cage through another hole. ClO2 gas concentrations were measured intermittently.
Pathological examination. Mice were sacrificed by an intramuscular injection of pentobarbital sodium, and their lungs were removed carefully and weighed. A portion of the lung was homogenized with PBS and aliquots were assayed for virus titre by using MDCK cells. The virus titre was expressed as TCID50. Another portion of the lung was fixed in buffered formalin and stained with haematoxylin and eosin for histopathological examinations.
Assay of in vitro infectivity, HA titre and NA activity of virus. Influenza virus (1 mg protein ml—1) was treated with ClO2 at various concentrations for 2 min at 0 °C in PBS. The reaction was terminated by adding a twofold molar excess of Na2S2O3. The in vitro infectivity of the virus was determined by using MDCK cells as indicator cells. Briefly, 1 x 10⁶ cells were inoculated in a Petri dish of 6 cm diameter using 10 ml Eagle’s MEM containing 10 % fetal bovine serum. Cells were grown until confluent (about 2 days) and then inoculated with tenfold serial dilutions of virus, treated or not treated with ClO2, suspended in PBS. Cells were next overlaid with freshly prepared medium without serum, but supplemented with 0.9% agar, 2.5 μg trypsin ml-1, 100 units penicillin G ml-1 and 100 μg streptomycin ml-1. The culture dish was incubated at 37 °C for 3-4 days in 95 % air/5 % CO2. The cells were then fixed and stained with crystal violet to count the number of plaques. The concentrations of ClO2 and/or Na2S2O3 used in the above experiment had no effect on the growth of MDCK cells. For the HA titre assay, twofold serial dilutions of treated (0 °C, 2 min, in PBS) virus were prepared in PBS and added to a round-bottomed 96-well microtitre plate (50 μg per well). Chicken red blood cells (2 x 10⁶ cells in 50 μl were then added and incubated for 1 h at 4 °C. End-point HA titres were expressed as the reciprocal of the last dilution that showed complete haemagglutination. For the NA assay, virus was diluted to 8 mg protein ml-1, and then 2 mM 2'-(4-methylumbelliferyl)-α-D-N-acetylneuraminic acid (sodium salt) in calcium-MES buffer [32.5 mM MES buffer (pH 6.5), 4 mM CaCl2] was added to a final concentration of 1 mM. The mixture was incubated for 1 h at 37 °C. The reaction was terminated by adding 800 μl glycine buffer (0.1 M, pH 10.7) containing 25% ethanol. Fluorescence intensity was measured (λex=365 nm, λem=450 nm) by a spectrofluorophotometer (model RF-5300PC; Shimadzu).
Fig. 1. (a) Schematic structure of a ClO2 generator. (b) Experimental set-up for exposure of mice to influenza A virus aerosols and ClO2 gas.
Sequencing and mass spectrometry (MS) of peptides. Synthetic peptides HA1 (NPENGTCYPG) and HA2 (RNLLWLTGKN) correspond to aa 101-110 and 162-171, respectively, of the HA protein. Peptides NA1 (FESVAWSASA) and NA2 (SGYSGSFVQH) correspond to aa 174-183 and 400-409, respectively, of the NA protein. They were obtained from Global Peptide Services. These peptides (2 mM each) were treated with 4 mM ClO2 at 25 °C for 2 min in PBS in a volume of 500 ml. After the reaction, a twofold molar excess (1.6 μl of 2.5 M Na2S2O3 was added to terminate the reaction. A portion (100 μl of the reaction mixture was then loaded for highperformance liquid chromatography (HPLC) using a reverse-phase column (Cosmosil 5C18-AR-300, 4.6 mm inner diameter, 250 mm long; Nacalai Tesque). The column was eluted with a solvent of 0.1 % (v/v) trifluoroacetic acid for 6 min and then with a linear gradient of acetonitrile from 10 to 50 % in the above solvent over the next 54 min at a flow rate of 1 ml min-1. Peptides were monitored by absorption at 270 nm. Peak materials (peptides) were collected and lyophilized. The lyophilized peptides were next analysed by Edman degradation using a protein sequencer (Procise; Applied Biosystems) to determine their amino acid sequences. Molecular masses of peptides and amino acid residues were determined by using a mass spectrometer (model Ultraflex; Bruker Daltonik) in matrix-assisted laser desorption/ ionization-time of flight (MALDI-TOF) and MALDI-TOF/TOF (tandem MS) modes. α-Cyano-4-hydroxycinnamic acid was used as a matrix.
Statistical analysis. Data were analysed by using Student’s t-test or Fisher’s exact test. P values <0.05 were considered statistically significant.
Results
Simultaneous exposure of mice to virus aerosols and ClO2 gas
ClO2 gas made by a ClO2 generator (Fig. 1a) was delivered into the mouse cage for 15 min simultaneously with aerosols of PBS alone or of influenza A virus suspended in PBS (Fig. 1b). The ClO2 gas concentration in the mouse cage of the ClO2-treated group during this period was 0.032 ± 0.026 p.p.m. (time-weighted mean ± SD). As a ClO2-untreated control, only air (0 p.p.m. ClO2) and aerosols of influenza virus suspended in PBS were delivered into the mouse cage housing another group of 15 mice. In the ClO2-untreated control group on day 3 (72 h), the pulmonary titre (TCID50) of the virus was 106.7±0.2 (n=5), whereas it was 102.6±1.5 in the ClO2-treated group (P=0.003, Student’s t-test) (Table 1), demonstrating clearly that ClO2 gas was effective in decreasing the number of infectious viruses in mouse lungs (a similar result was obtained in another independent experiment). Cumulative mortality at day 16 was 70% (7/10) in the ClO2-untreated group and 0% (0/10) in the ClO2-treated group (P=0.002, Fisher’s exact test) (Table 2). This result indicates that ClO2 gas can prevent mortality of mice challenged with influenza A virus aerosols. We confirmed the reproducibility of the above result in another experiment, in which the mortality was 5/10 mice without ClO2 gas, and 0/10 with 0.03 p.p.m. ClO2 gas (P=0.03).
Table 1.
Pulmonary virus titres of each mouse challenged with influenza A virus aerosols in the absence or presence of 0.03 p.p.m. ClO2 gas
| [CIO2 gas] (p.p.m.) |
Virus titre in each mouse (log10)* | Mean ± SD | ||||
| 0 | 6.3 | 6.8 | 6.8 | 6.8 | 6.8 | 6.7 ± 0.2† |
| 0.03 | 1.3 | 2.1 | 3.6 | 4.8 | 1.3 | 2.6 ± 1.5† |
†P=0.003 when the means of two groups were compared (Student’s t-test).
Table 2.
Mortality of mice exposed to aerosols of influenza A virus in the absence or presence of 0.03 p.p.m. ClO2 gas
Values are the number of mice that died at each time point after virus challenge.
| [ClO2 gas] (p.p.m.) | Time after virus challenge (days) | Total | ||||||
| 1-10 | 11 | 12 | 13 | 14 | 15 | 16 | ||
| 0 | 0 | 3 | 0 | 0 | 1 | 1 | 2 | 7* |
| 0.03 | 0 | 0 | 0 | 0 | 0 | 0 | 0 | 0* |
Relative body mass (body mass at day 7 compared with that at day 0) was 1.09 ± 0.08 (n=5) in the ClO2-treated group and 0.91±0.04 (n=5) in the untreated group (P=0.002, Student’s t-test) (Table 3). This result further supports the protection of mice from morbidity caused by influenza A virus. As another control, ClO2 gas (0.03 p.p.m., without virus) and PBS aerosols (without virus) were delivered into a cage housing another group of 15 mice to know whether ClO2 gas at a concentration of 0.03 p.p.m. has any toxic effect on mice. Mice were apparently completely healthy for the 21 days of observation. Microscopic examination of histopathological specimens of lungs from five mice treated with 0.03 p.p.m. ClO2 gas and PBS aerosols showed that their lungs were completely normal (data not shown).
Table 3.
Body mass of mice 1 week after challenge with influenza A virus in the absence or presence of 0.03 p.p.m. ClO2 gas
| [ClO2 gas] (p.p.m.) |
Body mass (g) at day: | Relative body mass* | |
| 0 | 7 | ||
| 0 | 28.4 ± 1.2 | 25.7 ± 1.3 | 0.90 ± 0.04† |
| 0.03 | 26.0 ± 1.8 | 28.3± 2.1 | 1.09 ± 0.08† |
†P=0.002 when relative body masses of the 0 and 0.03 p.p.m. ClO2 groups were compared (Student's t-test, n=5 in each group).
Delayed gas-delivery experiment
Next, we examined the effect of ClO2 gas delivered for 15 min into the mouse cage at various delay times after commencement of the delivery of influenza virus aerosols. The purpose of this experiment was to determine whether ClO2 gas delivered after the virus aerosols would still be able to prevent viral infection. Mortality of mice was 0 % (0/10) when ClO2 was delivered simultaneously with the virus aerosols (0 min delay, P=0.022 versus no-ClO2 group) (Table 4), confirming the result shown in Table 2. When ClO2 gas was delivered 5 min after the delivery of virus aerosols (5 min delay), mortality was 10% (1/10) (P=0.081 versus no-ClO2 group). The mortality rate was 50 % (5/10) with a 15 min delay, which was the same as in animals that received no ClO2 gas treatment (Table 4). The result indicates that ClO2 gas was an effective preventative of influenza virus infection when present in the environment simultaneously with the virus aerosols. When delivered after a 5 min delay, it may have been slightly effective (P=0.081), but it was completely ineffective when delivered 15 min after commencement of the delivery of the virus aerosols. Taken together, these results indicate that ClO2 gas inactivated the virus before it entered the lungs, but that it lacked the ability to inactivate viruses that had already entered the lungs and established infection. In summary, ClO2 gas, at an extremely low concentration (below the long-term permissible exposure level to humans), is effective at preventing infection of mice by influenza A virus without any harmful effects.
Table 4.
Mortality of mice challenged with influenza A virus aerosols in the absence or presence of 0.03 p.p.m. ClO2 gas that was delivered for 15 min at various delay times after commencement of the delivery of virus aerosols
Values are the number of mice that died at each time point after virus challenge.
| ClO2 gas delay time (min) | Time after virus challenge (days) | Total | ||||||
| 8 | 9 | 10 | 11 | 12 | 13 | 14 | ||
| 0 | 0 | 0 | 0 | 0 | 0 | 0 | 0 | 0* |
| 5 | 0 | 1 | 0 | 0 | 0 | 0 | 0 | 1† |
| 10 | 2 | 2 | 0 | 0 | 0 | 0 | 0 | 4 |
| 15 | 2 | 3 | 0 | 0 | 0 | 0 | 0 | 5 |
| No ClO2 | 0 | 2 | 2 | 1 | 0 | 0 | 0 | 5 |
†P= 0.081 when compared with the no-ClO2 group (Fisher’s exact test, n=10 in each group).
Effect of ClO2 on the infectivity of influenza A virus in vitro
Influenza A virus was treated in vitro with ClO2 and its infectivity was assayed by using cultured cells. Infectivity of the virus decreased markedly after treatment with 40-320 μM ClO2, demonstrating that ClO2 indeed inactivates the infectivity of the virus (Table 5). As the HA and NA proteins on the virus surface (envelope) are indispensable to the infectivity of the virus, we assayed their biological activities. As shown in Table 5, both HA and NA activities decreased markedly after ClO2 treatment in vitro. This result suggests that the reduction in the infectivity of influenza virus is attributable to the decrease of biological activities of the HA and NA proteins on the virus envelope.
Table 5.
In vitro infectivity of influenza A virus suspension treated with ClO2
Influenza A virus was treated with ClO2 at 0 °C for 2 min and subjected to various assays. Virus and HA titres are the means of two experiments. NA activity is the mean ± SD of five experiments. nd, Not determined.
| Concentration of ClO2 (μM) | Virus titre (p.f.u. ml-1) | HA titre* | NA activity [units (mg protein)-1] |
| 0 | 5.8 ±105 | 29 | 0.23 ±0.004 |
| 40 | 5.0 ±104 | 28 | 0.21 ±0.009† |
| 80 | <5.0 ±101 | 25 | 0.19±0.006‡ |
| 160 | <5.0 ±101 | 25 | 0.11 ±0.004‡ |
| 240 | ND | 24 | 0.059 ±0.002‡ |
| 320 | ND | 22 | 0.041 ±0.001‡ |
†P<0.05 when compared with 0 μМ ClO2 (Student’s t-test).
‡P<0.0001 when compared with 0 μМ ClO2 (Student’s t-test).
Denaturation of HA and NA proteins
We speculated that ClO2 denatured the HA and NA proteins and inactivated their biological activities. To provide support for this hypothesis, we selected two model decapeptides (HA1 and HA2) from HA and two (NA1 and NA2) from NA (for sequences, see Methods). After treatment of these peptides with ClO2, they were analysed by reverse-phase HPLC. When these four peptides were treated individually with ClO2, there were several novel peptide peaks on the chromatograms that differed completely from the original peptide peaks (data not shown). This indicates that the original peptides were modified covalently by reaction with ClO2. This hypothesis was supported further by the fact that, upon sequencing (by Edman degradation) of the peptide peaks recovered from HPLC, some amino acid residues in the peptides were not identified (Table 6). For example, regarding the peptide HA2 (RNLLWLTGKN, aa 162-171) treated with ClO2, the sequence of the peptide peak recovered from HPLC was RNLLXLTGKN; the fifth amino acid residue (Trp166 in the original protein) could not be identified by the conventional protein-sequencing method. This indicates strongly that this residue (tryptophan) was modified covalently by ClO2. Likewise, other peptides were also found to be modified at tryptophan and tyrosine residues (Table 6). It is unclear whether the cysteine residue of HA1 was modified by ClO2, because cysteine residues are not positively identifiable by this conventional sequencing method.
Table 6.
Amino acid sequences of ClO2-treated model peptides derived from the HA and NA proteins of influenza A virus
Each model peptide (2 mM) was treated with 4 mM ClO2 at 25 °C for 2 min, and then analysed individually by HPLC. Peak fractions of HPLC were recovered and subjected to protein sequencing. X denotes amino acid residues that gave unusual peaks on chromatograms of the protein sequencer and were therefore not identified.
| Name | Original peptide | ClO2-treated peptide | |
| aa | Sequence | Sequence found | |
| HA1 | 101-110 | NPENGTCYPG | NPENGTCXPG |
| HA2 | 162-171 | RNLLWLTGKN | RNLLXLTGKN |
| NA1 | 174-183 | FESVAWSASA | FESVAXSASA |
| NA2 | 400-409 | SGYSGSFVQH | SGXSGSFVQH |
Covalent modification of tryptophan and tyrosine residues by ClO2 was confirmed by MS. As shown in Table 7, in the modified HA2 and NA1 peptides, there was an increase of about 32 or 48 atomic mass units in the tryptophan residues, indicating that two or three atoms of oxygen were incorporated covalently into tryptophan residues. Likewise, there was an increase of about 32 or 48 atomic mass units in the tyrosine residues in the modified HA1 and NA2 peptides (Table 7), indicating the covalent incorporation of two or three atoms of oxygen into tyrosine residues. Taken together, we conclude that amino acid residues in the HA and NA proteins, primarily tryptophan and tyrosine residues, are modified covalently by ClO2. Such modifications of amino acid residues appear to denature the HA and NA proteins of influenza A virus, which are indispensable for its infectivity, and consequently abolish infectivity of the virus.
Table 7.
MS analyses of ClO2-treated model peptides derived from the HA and NA proteins of influenza A virus
Peptides HA1 (NPENGTCYPG), HA2 (RNLLWLTGKN), NA1 (FESVAWSASA) and NA2 (SGYSGSFVQH) (each 2 mM) were treated with 4 mM ClO2 at 25 °C for 2 min. They were then analysed individually by HPLC and two peak fractions were recovered from each HPLC run. The peak fractions were analysed by MS. ND, Not determined.
| Peptide* | Parent ion ([M + H]+)† | Amino acid residue‡ | ||||
| Expected | Found | δ§ | Expected | Found | δ§ | |
| a (HA1) | 1051.1 | 1096.4 | 45.3 | 181.2 ( Y) | ND | ND |
| b (HA1) | 1051.1 | 1083.8 | 32.7 | 181.2 ( Y) | 213.0 | 31.8 |
| c (HA2) | 1214.1 | 1246.7 | 32.6 | 204.2 (W) | 236.1 | 31.9 |
| d (HA2) | 1214.1 | 1262.7 | 48.6 | 204.2 (W) | 252.1 | 47.9 |
| e (NA1) | 1054.1 | 1102.5 | 48.4 | 204.2 (W) | 252.1 | 47.9 |
| f (NA1) | 1054.1 | 1086.4 | 32.3 | 204.2 (W) | 236.0 | 31.8 |
| g (NA2) | 1068.1 | 1099.8 | 31.7 | 181.2 ( Y) | ND | ND |
| h (NA2) | 1068.1 | 1116.5 | 48.4 | 181.2 ( Y) | 229.0 | 47.8 |
†Mass/charge of the [M + H]+ ion of the ClO2-treated and HPLC-recovered peptides, determined by MALDI-TOF MS.
‡Mass/charge of each amino acid residue of the peptide determined by MALDI-TOF/TOF MS. Only the amino acid residue whose mass/ charge was significantly different from that of the original residue is shown. The mass of water (18.0) has been added to the mass/charge for clarity.
§δ denotes the difference between expected and found mass/charge values.
Discussion
We have demonstrated that ClO2 gas at an extremely low concentration can prevent influenza A virus infection of mice caused by aerosols. According to the US Occupational Safety and Health Administration, the 8 h permissible exposure level of ClO2 in human workplaces is 0.1 p.p.m. The level of ClO2 gas (0.03 p.p.m.) used in this study is well below this level, and our results indicate that ClO2 at this level could be used in the presence of humans to prevent their infection by influenza A virus and possibly other related virus infections of the respiratory tract. Specifically, ClO2 gas could be used in places such as offices, theatres, hotels, schools and airport buildings without evacuating people, thus not interrupting their normal activities.
Current growing concerns about the threat posed by highly pathogenic H5N1 avian influenza virus have prompted interest in evaluating measures against this virus. ClO2 and chlorine have long been used as disinfectants of public water supplies. Thus far, chlorine treatment (chlorination) represents the most common form of disinfection used in water treatment. Rice et al. (2007) reported recently that the H5N1 strain of influenza A virus was inactivated by chlorine in an in vitro experiment. In their experiment, the free chlorine concentration typically used in drinking-water treatment was sufficient to inactive the virus by more than three orders of magnitude. Although the strain of influenza virus used in our present experiment (H1N1) differs from that of Rice et al. (2007), it is suggested that our present method, namely treatment of influenza virus by ClO2, provides another effective manoeuvre for the treatment of public water supplies contaminated by the virus, and it paves a new way for prevention of pandemic influenza.
ClO2 gas is very soluble in water, and is in equilibrium between the gas and water phases. In our preliminary experiment, ClO2 reached equilibrium between the gas and water phases within 30 s (half-maximal in 20 s) (N. Ogata, unpublished data). Generally speaking, a water-soluble gaseous substance reaches equilibrium between the gas and water phases according to Henry’s law, C=kP, where C is the concentration of a substance in the water phase, P is partial pressure of the substance in the gas phase and k is an equilibrium constant. When the diameter of the aerosol is in the range 1-10 μm, as in the present experiment, equilibrium is reached within 1 min. We also found that Henry’s equilibrium gas constant k regarding the ClO2-water equilibrium, namely k in the above equation, was 3.9 x 10—5 mol l—1 Pa—1 (N. Ogata, unpublished data). Therefore, the ClO2 concentration in the virus aerosols is theoretically 0.12 μM when the aerosols are in equilibrium with 0.03 p.p.m. ClO2 gas. This suggests further that the influenza A virus is inactivated at 0.12 mM ClO2 in water (PBS in our present experiment).
We have shown that ClO2 denatures (abolishes the functions of) the HA and NA proteins on the envelope of the influenza virus (Table 5). As these proteins are indispensable for the infectivity of this virus, the fact that they were denatured by ClO2 could explain why infectivity of the virus decreased after treatment with ClO2. However, it is noteworthy that the reduction in infectivity, as demonstrated by plaque assay, did not necessarily parallel the reductions in HA and NA activities (Table 5). One possibility is the presence of other protein(s) in the virus that is/are critical and indispensable for its infectivity and is/are denatured by ClO2. For example, the M2 protein, a proton channel in the virus envelope, could be a target of ClO2. This protein is indispensable for the virus to establish infection (Tang et al., 2002). A tryptophan residue (Trp41) of this protein protrudes into the proton channel and works as a ‘gate’ for a proton that enters and passes through the channel (Tang et al., 2002). As tryptophan residues were modified by ClO2 in this study (Tables 6 and 7), it is likely that ClO2 could also modify the tryptophan residue (Trp41) in this protein and abolish its function.
Tyrosine (Tyr108) and tryptophan (Trp166) residues in HA are conserved among many strains of influenza virus and constitute the binding site of the protein for the receptor (sialic acid) [Tyr98 and Trp153, respectively, in Stevens et al. (2006)]. Therefore, covalent modification of these amino acid residues (Tables 5-7) explains the reduction in HA activity caused by ClO2 treatment. Likewise, tyrosine (Tyr402) and tryptophan (Trp179) residues are conserved in NA. They constitute an active-site pocket of the protein and are necessary for its catalytic activity [Tyr406 and Trp178, respectively, in Lentz et al. (1987)]; this view is supported by the fact that complete loss of its enzymic activity occurs by their substitution with other amino acids (Lentz et al., 1987). Therefore, covalent modification of these amino acid residues in NA by ClO2 would explain its inactivation by ClO2.
Acknowledgements
We thank Dr Philip R.Wyde, Koji Abe, Cholsong Lee and Hirofumi Morino for their contribution to this work. We also thank Dr Yoshinobu Okuno for the New Caledonia strain influenza A virus.
REFERENCES:
Bentz, J. & Mittal, A. (2003). Architecture of the influenza hemagglutinin membrane fusion site. Biochim Biophys Acta 1614, 24-35.
Chen, Y. S. & Vaughn, J. M. (1990). Inactivation of human and simian rotaviruses by chlorine dioxide. Appl Environ Microbiol 56, 1363-1366.
Eleraky, N. Z., Potgieter, L. N. & Kennedy, M. A. (2002). Virucidal efficacy of four new disinfectants. J Am Anim Hosp Assoc 38, 231-234.
Foschino, R., Nervegna, I., Motta, A. & Galli, A. (1998). Bactericidal activity of chlorine dioxide against Escherichia coli in water and on hard surfaces. J Food Prot 61, 668-672.
Fukayama, M. Y., Tan, H., Wheeler, W. B. & Wei, C. I. (1986). Reactions of aqueous chlorine and chlorine dioxide with model food compounds. Environ Health Perspect 69, 267-274.
Ge, Q., Filip, L., Bai, A., Nguyen, T., Eisen, H. N. & Chen, J. (2004). Inhibition of influenza virus production in virus-infected mice by RNA interference. Proc Natl Acad Sci USA 101, 8676-8681.
Ghendon, Y., Klimov, A., Gorodkova, N. & Dohner, L. (1981). Genome analysis of influenza A virus strain isolated during an epidemic of 1979-1980. J Gen Virol 56, 303-313.
Gong, J., Xu, W. & Zhang, J. (2007). Structure and functions of influenza virus neuraminidase. Curr Med Chem 14, 113-122.
Harakeh, S., Illescas, A. & Matin, A. (1988). Inactivation of bacteria by Purogene. J Appl Bacteriol 64, 459-463.
Kong, W.-P., Hood, C., Yang, Z.-Y., Wei, C.-J., Xu, L., Garcia-Sastre, A., Tumpey, T. M. & Nabel, G. J. (2006). Protective immunity to lethal challenge of the 1918 pandemic influenza virus by vaccination. Proc Natl Acad Sci USA 103, 15987-15991.
Lentz, M. R., Webster, R. G. & Air, G. M. (1987). Site-directed mutation of the active site of influenza neuraminidase and implications for the catalytic mechanism. Biochemistry 26, 5351-5358.
Li, J. W., Xin, Z. T., Wang, X. W., Zheng, J. L. & Chao, F. H. (2004). Mechanisms of inactivation of hepatitis A virus in water by chlorine dioxide. Water Res 38, 1514-1519.
Loret, J. F., Robert, S., Thomas, V., Cooper, A. J., McCoy, W. F. & Levi, Y. (2005). Comparison of disinfectants for biofilm, protozoa and Legionella control. J Water Health 3, 423-433.
Lynch, E., Sheerin, A., Claxson, A. W., Atherton, M. D., Rhodes, C. J., Silwood, C. J., Naughton, D. P. & Grootveld, M. (1997). Multicomponent spectroscopic investigations of salivary antioxidant consumption by an oral rinse preparation containing the stable free radical species chlorine dioxide (CIO2) Free Radic Res 26, 209-234.
McCauley, J. W. & Mahy, B. W. (1983). Structure and function of the influenza virus genome. Biochem J 211, 281-294.
Moran, T., Pace, J. & McDermott, E. E. (1953). Interaction of chlorine dioxide with flour: certain aspects. Nature 171, 103-106.
Nicholson, K. G., Wood, J. M. & Zambon, M. (2003). Influenza. Lancet 362, 1733-1745.
Ogata, N. (2007). Denaturation of protein by chlorine dioxide: oxidative modification of tryptophan and tyrosine residues. Biochemistry 46, 4898-4911.
Okull, D. O., Demirci, A., Rosenberger, D. & LaBorde, L. F. (2006). Susceptibility of Penicillium expansum spores to sodium hypochlorite, electrolyzed oxidizing water, and chlorine dioxide solutions modified with nonionic surfactants. J Food Prot 69, 1944-1948.
Palese, P. (2004). Influenza: old and new threats. Nat Med 10, S82-S87.
Reid, A. H. & Taubenberger, J. K. (2003). The origin of the 1918 pandemic influenza virus: a continuing enigma. J Gen Virol 84, 2285-2292.
Rice, E. W., Adcock, N. J., Sivaganesan, M., Brown, J. D., Stallknecht, D. E. & Swayne, D. E. (2007). Chlorine inactivation of highly pathogenic avian influenza virus (H5N1). Emerg Infect Dis 13, 1568-1571.
Schwartz, T., Hoffmann, S. & Obst, U. (2003). Formation of natural biofilms during chlorine dioxide and u.v. disinfection in a public drinking water distribution system. J Appl Microbiol 95, 591-601.
Simonet, J. & Gantzer, C. (2006). Degradation of the Poliovirus 1 genome by chlorine dioxide. J Appl Microbiol 100, 862-870.
Sivaganesan, M., Rice, E. W. & Marinas, B. J. (2003). A Bayesian method of estimating kinetic parameters for the inactivation of Cryptosporidium parvum oocysts with chlorine dioxide and ozone. Water Res 37, 4533-4543.
Skehel, J. J. & Hay, A. J. (1978). Influenza virus transcription. J Gen Virol 39, 1-8.
Solorzano, A., Zheng, H., Fodor, E., Brownlee, G. G., Palese, P. & Garcia-Sastre, A. (2000). Reduced levels of neuraminidase of influenza A virus correlate with attenuated phenotypes in mice. J Gen Virol 81, 737-742.
Stevens, J., Blixt, O., Glaser, L., Taubenberger, J. K., Palese, P., Paulson, J. C. & Wilson, I. A. (2006). Glycan microarray analysis of the hemagglutinins from modern and pandemic influenza viruses reveals different receptor specificities. J Mol Biol 355, 1143-1155.
Sy, K. V., Murray, M. B., Harrison, M. D. & Beuchat, L. R. (2005). Evaluation of gaseous chlorine dioxide as a sanitizer for killing Salmonella, Escherichia coli O157 : H7, Listeria monocytogenes, and yeasts and molds on fresh and fresh-cut produce. J Food Prot 68, 1176-1187.
Tang, Y., Zaitseva, F., Lamb, R. A. & Pinto, L. H. (2002). The gate of the influenza virus M2 proton channel is formed by a single tryptophan residue. J Biol Chem 277, 39880-39886.
Taylor, G. R. & Butler, M. (1982). A comparison of the virucidal properties of chlorine, chlorine dioxide, bromine chloride and iodine. J Hyg (Lond) 89, 321-328.
Thompson, W. W., Shay, D. K., Weintraub, E., Brammer, L., Cox, N., Anderson, L. J. & Fukuda, K. (2003). Mortality associated with influenza and respiratory syncytial virus in the United States. JAMA 289, 179-186.
Tsuchiya, E., Sugawara, K., Hongo, S., Matsuzaki, Y., Muraki, Y., Li, Z. N. & Nakamura, K. (2001). Antigenic structure of the haemagglutinin of human influenza A/H2N2 virus. J Gen Virol 82, 2475-2484.
US Department of Labor, Occupational Safety and Health Administration (2006). Occupational Safety and Health Guideline for Chlorine Dioxide.
Wagner, R., Matrosovich, M. & Klenk, H. D. (2002). Functional balance between haemagglutinin and neuraminidase in influenza virus infections. Rev Med Virol 12, 159-166.
Webby, R. J. & Webster, R. G. (2003). Are we ready for pandemic influenza? Science 302, 1519-1522.
Webster, R. G., Hulse-Post, D. J., Sturm-Ramirez, K. M., Guan, Y., Peiris, M., Smith, G. & Chen, H. (2007). Changing epidemiology and ecology of highly pathogenic avian H5N1 influenza viruses. Avian Dis 51, 269-272.
WHO (2003). Influenza: Report by the Secretariat to the Fifty-Sixth World Health Assembly (WHO, Geneva), A56/23, 17 March 2003.
Wilson, S. C., Wu, C., Andriychuk, L. A., Martin, J. M., Brasel, T. L., Jumper, C. A. & Straus, D. C. (2005). Effect of chlorine dioxide gas on fungi and mycotoxins associated with sick building syndrome. Appl Environ Microbiol 71, 5399-5403.
Summary results and visualisation
Mortality rates among 10 mice were compared over 21 days when exposed to either chlorine dioxide gas (0.03 ppm) or air for 15 minutes simultaneously with Virus I (1LD50) .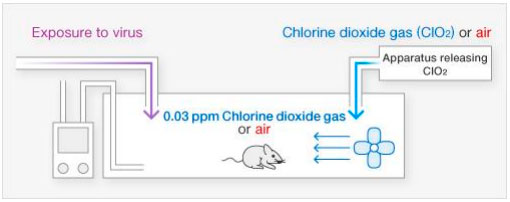
[Results-1]
In the presence of 0.03 ppm chlorine dioxide gas, the death of mice due to infection with Virus I was prevented (p = 0.002) . The level of chlorine dioxide gas to which humans can safely be exposed for long periods of time is 0.1 ppm (time-weighted average [TWA] for human exposure for 8 hours) .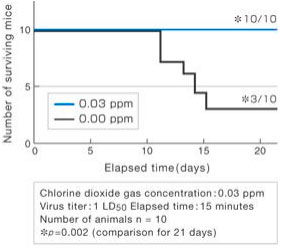
[Results-2]
In the presence of chlorine dioxide gas (0.03 ppm), Virus I in the lungs of mice was significantly reduced (p = 0.003).
The number of deaths among 10 mice was monitored in the case where exposure to chlorine dioxide gas (0.03 ppm) was started either simultaneously with 0, or 5, 10, or 15 minutes after exposure to Virus I (1LD50), and it was compared to the case where the mice were not exposed to the chlorine dioxide gas.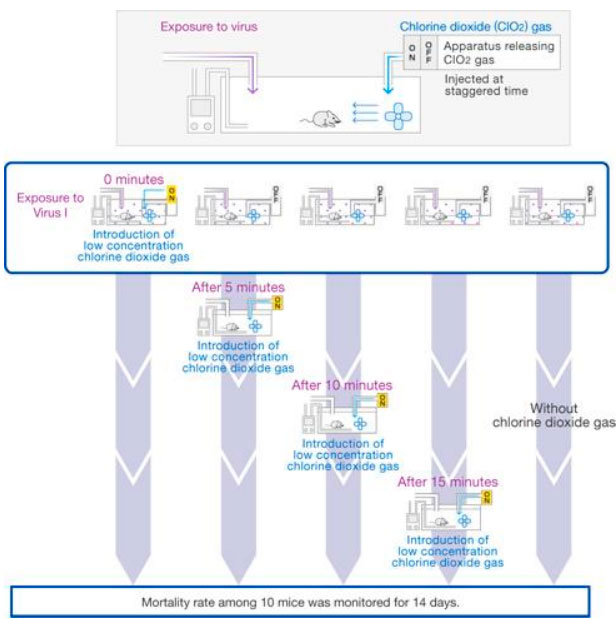
[Results]
When mice were exposed to chlorine dioxide gas starting 15 minutes after exposure to Virus I, the same number of mice (5) died as when chlorine dioxide gas was not used, but when the mice were exposed to chlorine dioxide gas simultaneously with exposure to Virus I, none of the mice died at all (p = 0.022).
Moreover, although the difference was not statistically significant (p = 0.081), deaths among the mice were limited to only one animal even when exposure to chlorine dioxide gas was started after the waiting time of 5 minutes.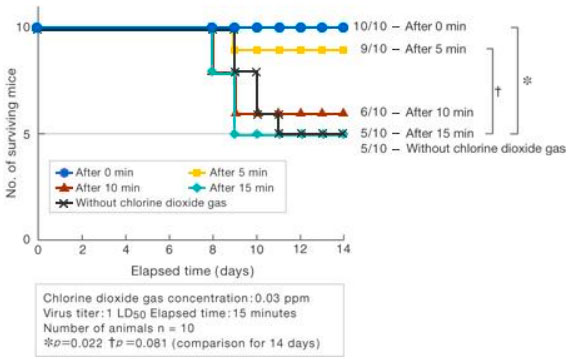
For details, please refer to the abstract of the paper.
Ogata N and Shibata T. J Gen Virol 89,60-67 (2008).


